What Your Pharmacy Shelves Won’t Tell You About Hair Loss Treatment
A Data Science Approach to Comparing Treatments with Network Meta-Analysis
data science
statistics
network meta-analysis
health
Author
Jiro Amato
Published
January 17, 2026
The Problem: Too Many Treatments, Not Enough Comparisons
Imagine that you are experiencing hair loss and you want to do something about it. You go online and find three main options for treatment. Minoxidil (commonly known as Rogaine), finasteride and dutasteride. Each one has studies showing it beats a placebo. Great. But which one actually works best?
The frustrating part for the consumer is that most clinical trials only test one treatment against a placebo. Sometimes they’ll compare two treatments directly. But running trials that compare every possible pair? That’s expensive, takes time and as more treatments hit the market, it becomes basically impossible.
So how do researchers figure out which treatment ranks first when they’ve never been directly compared?
That’s where network meta-analysis (NMA) comes in.
Indirect Comparisons Through a Common Reference
Network meta-analysis is built on a simple idea. If we know how Treatment A compares to a placebo, and how Treatment B compares to that same placebo, we can estimate how A and B compare to each other.
Let’s make this concrete with numbers.
Suppose Study 1 finds that finasteride increases hair count by 15 hairs/cm² compared to placebo and Study 2 finds that minoxidil increases hair count by 12 hairs/cm² compared to placebo.
In this case, finasteride and minoxidil were never tested head-to-head. However, we can still infer that finasteride is roughly 3 hairs/cm² more effective (15 - 12 = 3).
This is called an indirect comparison. The placebo serves as the common comparator which acts as the bridge connecting the two treatments.
Building Out the Network
The real power of NMA comes when we have many treatments and many studies. You can picture all the evidence as a network. Each treatment is a node, including placebo. Each line (edge) between nodes represents studies that directly compared those two treatments (direct comparison).
The magic of NMA is that it synthesizes all available evidence into a coherent framework. Even if Treatment X and Treatment Y were never tested against each other, we can estimate their relative effectiveness through their shared connections to other treatments in the network.
Code
import networkx as nximport matplotlib.pyplot as pltG = nx.Graph()# Nodestreatments = ["Placebo","Minoxidil 2%\n(topical)","Minoxidil 5%\n(topical)","Minoxidil 0.25mg\n(oral)","Minoxidil 5mg\n(oral)","Finasteride 1mg\n(oral)","Finasteride 5mg\n(oral)","Dutasteride 0.5mg\n(oral)"]G.add_nodes_from(treatments)# Edgesedges = [ ("Placebo", "Minoxidil 2%\n(topical)", 6), ("Placebo", "Minoxidil 5%\n(topical)", 2), ("Placebo", "Finasteride 1mg\n(oral)", 4), ("Placebo", "Finasteride 5mg\n(oral)", 1), ("Placebo", "Dutasteride 0.5mg\n(oral)", 2), ("Minoxidil 2%\n(topical)", "Minoxidil 5%\n(topical)", 2), ("Minoxidil 2%\n(topical)", "Finasteride 1mg\n(oral)", 1), ("Finasteride 1mg\n(oral)", "Finasteride 5mg\n(oral)", 1), ("Finasteride 1mg\n(oral)", "Dutasteride 0.5mg\n(oral)", 2), ("Minoxidil 0.25mg\n(oral)", "Placebo", 1), ("Minoxidil 5mg\n(oral)", "Placebo", 1),]G.add_weighted_edges_from(edges)fig, ax = plt.subplots(figsize=(8, 6))pos = nx.spring_layout(G, k=2, iterations=50, seed=42)node_sizes = [800+400* G.degree(node) for node in G.nodes()]color_map = []for node in G.nodes():if"Placebo"in node: color_map.append("#95a5a6") # Gray for placeboelif"Dutasteride"in node: color_map.append("#e74c3c") # Red for dutasterideelif"Finasteride"in node: color_map.append("#3498db") # Blue for finasterideelse: color_map.append("#2ecc71") # Green for minoxidiledge_weights = [G[u][v]['weight'] *1.5for u, v in G.edges()]nx.draw_networkx_edges(G, pos, width=edge_weights, alpha=0.6, edge_color="#7f8c8d")nx.draw_networkx_nodes(G, pos, node_color=color_map, node_size=node_sizes, alpha=0.9)nx.draw_networkx_labels(G, pos, font_size=8, font_weight="bold")legend_elements = [ plt.scatter([], [], c="#95a5a6", s=150, label="Placebo"), plt.scatter([], [], c="#e74c3c", s=150, label="Dutasteride"), plt.scatter([], [], c="#3498db", s=150, label="Finasteride"), plt.scatter([], [], c="#2ecc71", s=150, label="Minoxidil")]ax.legend(handles=legend_elements, loc="upper left", title="Treatment Type")ax.set_title("Network of Hair Loss Treatment Comparisons\n(Gupta et al. 2022)", fontsize=14, fontweight="bold")ax.axis("off")plt.tight_layout()plt.show()
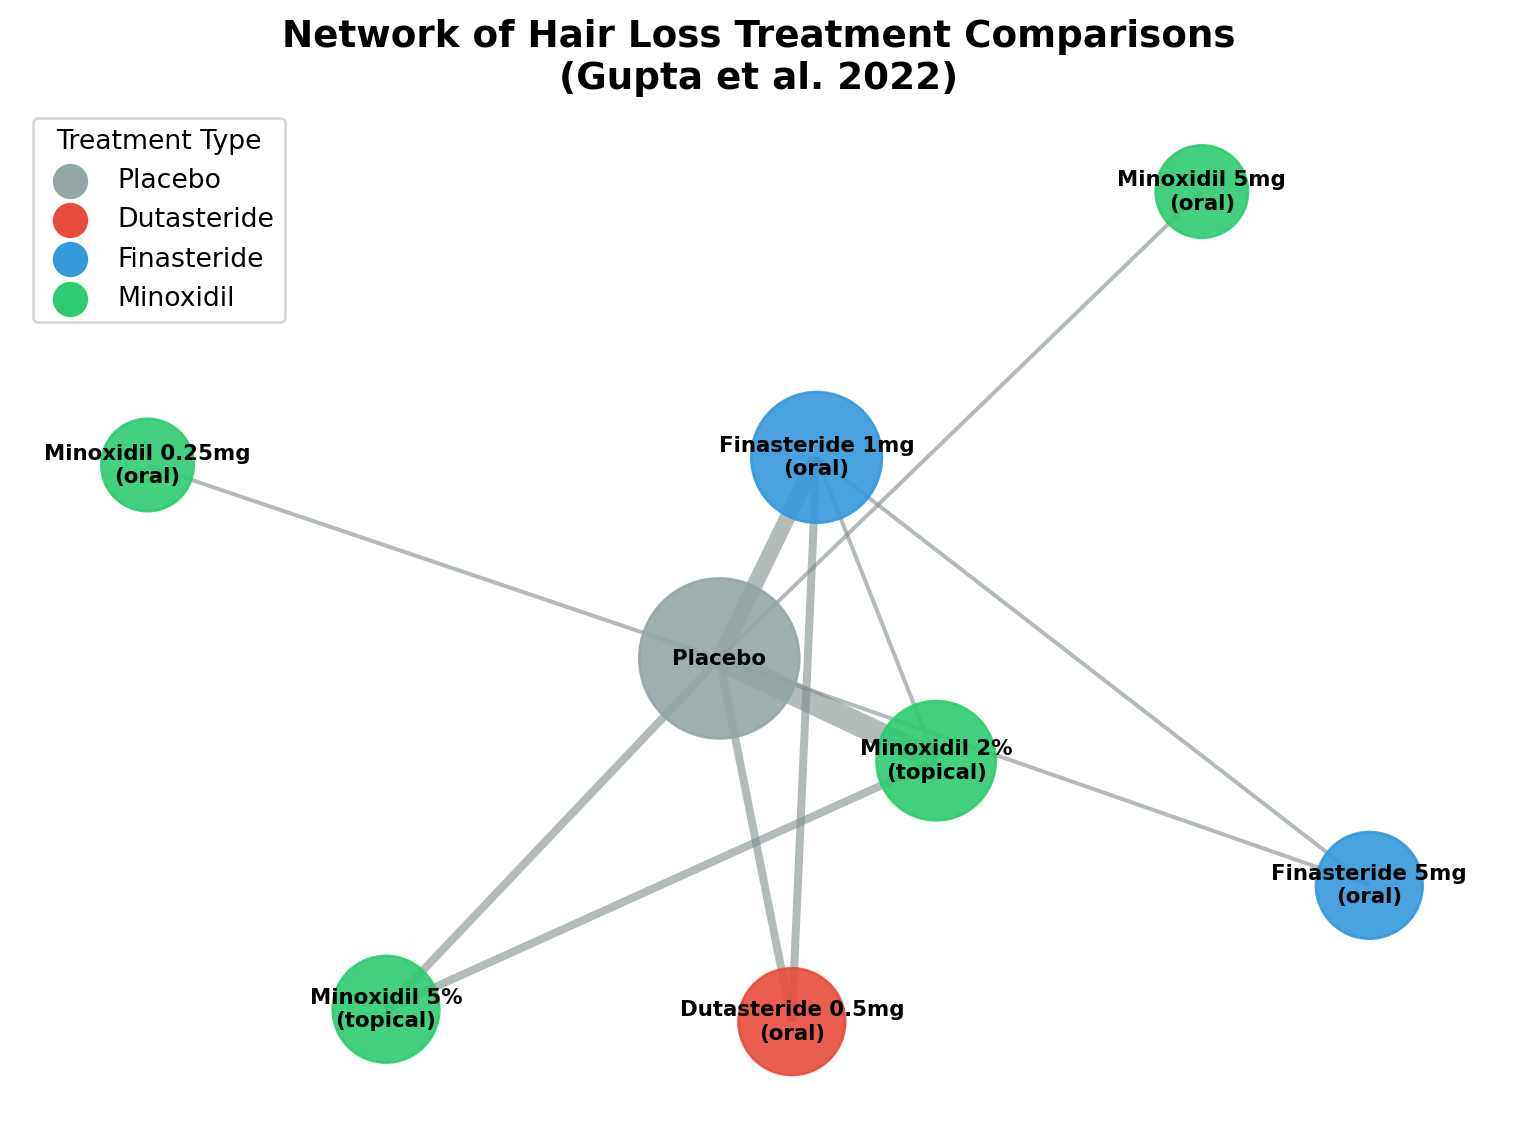
Figure 1: Network of treatment comparisons from the Gupta et al. 2022 study. Each node represents a treatment, and edges connect treatments that were directly compared in clinical trials. Node size reflects the number of studies involving that treatment, and edge thickness represents the number of direct comparisons.
The figure above shows the network from the Gupta study. Notice how placebo sits at the center, connecting to most treatments. This is typical since many trials compare a new treatment against placebo. The lines between treatments represent direct head-to-head comparisons from clinical trials.
Sometimes researchers have both direct evidence and indirect evidence for the same comparison. NMA combines them mathematically to get the most precise estimate possible. This combination of direct and indirect evidence is called mixed treatment comparison.
Mixed treatment comparison uses weighted averages. Larger sampled studies with less variability contribute more to the final estmation. Most modern NMA uses Bayesian statistics to quantify uncertainty and provide an estimation. This allows researchers to say things like “there’s a 96% chance Treatment A is the most effective.”.
Case Study: Ranking Hair Loss Treatments
In 2022, Gupta and colleagues published a NMA in JAMA Dermatology(Gupta et al. 2022). They wanted to answer exactly this question, “Among minoxidil, finasteride, and dutasteride, which works best for male pattern hair loss?”.
They took data from 23 clinical trials spanning several decades. The studies looked at different doses and formulations of the following treatments:
Oral dutasteride at 0.5 mg/day
Oral finasteride at 1 mg/day and 5 mg/day
Topical minoxidil in 2% and 5% solutions
Oral minoxidil at 0.25 mg/day and 5 mg/day
Placebo
Most studies compared a single treatment to placebo and only a few went head-to-head. By connecting all the studies through the network, the researchers could rank all treatments at once.
The results were clear. At 24 weeks, oral dutasteride (0.5 mg/day) came out on top. It had a SUCRA score of 96%. Then oral finasteride 5 mg at 88%. Topical minoxidil 5% at 80%. Oral finasteride 1 mg at 65%.
Code
import altair as altimport pandas as pd# SUCRA values from Gupta et al. 2022, Figure 3 (Column A: Total hair count at 24 weeks)data = pd.DataFrame({'Treatment': ['Dutasteride 0.5mg (oral)','Finasteride 5mg (oral)','Minoxidil 5% (topical)','Finasteride 1mg (oral)','Minoxidil 2% (topical)','Minoxidil 5mg (oral)','Placebo','Minoxidil 0.25mg (oral)' ],'SUCRA': [95.7, 87.8, 80.4, 65.2, 55.3, 29.6, 13.5, 8.4]})chart = alt.Chart(data).mark_bar().encode( x=alt.X('SUCRA:Q', title='SUCRA Value (%)', scale=alt.Scale(domain=[0, 100])), y=alt.Y('Treatment:N', sort='-x', title=None), color=alt.Color('SUCRA:Q', scale=alt.Scale(scheme='viridis'), legend=None)).properties( title='Efficacy Ranking of Hair Loss Treatments (Gupta et al. 2022)', width='container', height=280)chart
Figure 2: SUCRA rankings for hair loss treatments at 24 weeks (total hair count). Higher values indicate greater probability of being the most effective treatment. Data from Gupta et al. 2022.
Under the Hood
At its core, NMA relies on the consistency assumption which states that the indirect estimate should match up with the direct estimate when you have both available.
Suppose, Study 1 shows A beats placebo by 10 units. Study 2 shows B beats placebo by 6 units. The indirect math says A beats B by 4 units. If a third study directly compares A and B and finds A wins by 4 units, we’ve got consistency.
Here’s roughly how the statistical model works.
First, you define treatment effects. Each treatment gets an effect estimate relative to a common reference, usually placebo.
Then, you combine direct and indirect evidence. When both exist for a comparison, they get combined using inverse-variance weighting. More precise estimates from larger studies carry more weight.
Next, you estimate uncertainty. Bayesian methods give you not just point estimates but full probability distributions. So you know how confident to be in each ranking.
Finally, you rank the treatments. There’s a metric called SUCRA, Surface Under the Cumulative Ranking Curve. It summarizes the probability that each treatment is best, second-best, third-best, and so on. A SUCRA of 100% means the treatment is definitely best and 0% means it’s definitely worst.
The Gupta study ran 200,000 iterations of Markov Chain Monte Carlo sampling. That’s a lot of computation to make sure the results were stable.
Why This Matters
Think about someone standing in a pharmacy. They’re staring at the hair loss products. They want to know which one to buy.
Network meta-analysis gives them something real. A ranking based on all available evidence. Not marketing. Not one cherry-picked study.
Before this analysis, you might read one study showing finasteride works. Another showing minoxidil works. And you’d have no way to compare them. The NMA pulls together decades of clinical research into a clear order.
Dutasteride 0.5 mg/day (most effective)
Finasteride 5 mg/day
Oral minoxidil 5 mg/day
Finasteride 1 mg/day (the FDA-approved dose)
Topical minoxidil 5%
Topical minoxidil 2%
Oral minoxidil 0.25 mg/day
This ranking is useful for patients and doctors to make informed decisions. It also shows gaps in the evidence, for example, dutasteride’s long-term efficacy at 48 weeks was not well-studied. This gives researchers a clear direction for future research.
The Limitations
Network meta-analysis isn’t magic. It depends on some key assumptions holding up.
Transitivity: The studies being combined need to be similar enough that indirect comparisons make sense. If Study 1 enrolled young patients and Study 2 enrolled elderly patients, comparing their results through a common placebo might mislead you.
Consistency: When you have both direct and indirect evidence, they should roughly agree. Big inconsistencies suggest problems with assumptions.
Publication bias: If negative studies never get published, your network only includes treatments that looked like they worked. That can inflate the effectiveness estimates.
The Gupta study dealt with these issues. They assessed study quality using the Cochrane risk-of-bias tool. They evaluated network-wide evidence quality using the CINeMA framework. Gupta found that the evidence quality ranged from low to moderate for most comparisons. This is a common finding in NMA which reflects the imperfect nature of real-world clinical evidence.
Conclusion
Network meta-analysis takes scattered clinical evidence and turns it into something useful. Rankings you can actually act on.
Treatments can be compared indirectly through common reference points. That lets us answer questions no single trial could handle such as, “Which of these many treatments is actually best?”.
For hair loss, Gupta’s 2022 analysis gave a clear answer, oral dutasteride leads with higher-dose finasteride coming in next with topical minoxidil trailing behind. This NMA study is not the final word. New head-to-head trials will come along, the network will grow and estimates will become more precise.
The next time you are facing a decision with multiple options and conflicting evidence, look for a network meta-analysis. It might cut through the noise and show you what the data actually says.
References
Gupta, Aditya K., Maanasa Venkataraman, Mesbah Talukder, and Mary A. Bamimore. 2022. “Relative Efficacy of Minoxidil and the 5-α Reductase Inhibitors in Androgenetic Alopecia Treatment of Male Patients: A Network Meta-Analysis.”JAMA Dermatology 158 (3): 266–74. https://doi.org/10.1001/jamadermatol.2021.5743.